Pipeline as Code (PaaC) with Jenkins
What is Pipeline as Code?
Pipeline as Code is Jenkins' way of setting up a pipeline automatically using a text file called a Jenkinsfile (note the capital 'J').
Instead of clicking through the UI to configure jobs, we can put this file directly in our source code repository, or we can write it in the Jenkins job configuration itself.
The Jenkinsfile defines the stages in your CI/CD Pipeline. As we create jobs, there will be different stages defined within this file. It uses its own Domain Specific Language (DSL) which is very close to Groovy. Don't worry, you really don't need to be a Groovy expert to write a Jenkinsfile.
There are two types of syntax:
- Scripted: The older, more complex way.
- Declarative: The modern, structured way.
We are going to use Declarative syntax for this project because it's the way forward.
Key Concepts
- Pipeline: This is the main block that holds everything. Everything inside here is executed by Jenkins.
- Agent (Nodes): Defines where the pipeline runs. You can specify a specific node or let Jenkins choose any available agent.
- Stages: This is where the actual work happens. The pipeline is broken down into sequential stages.
- Steps: The specific commands to run inside a stage.
Example Structure
pipeline {
 agent {

 }
 tools {
   maven 'Maven 3.9.9'
 }
 environment {
   JAVA_HOME = '/usr/lib/jvm/java-17-openjdk-amd64'
 }

 stages {
        steps {
            // steps go here

        }

        post {
           // post actions go here
           success {
               echo 'This will run only if successful'
           }
              failure {
                echo 'This will run only if failed'
              }
        }
 }

}- agent: Where the Pipeline will run. It can be any node in Jenkins.
- tools: Where you define the tools needed, like Maven, JDK, NodeJS, etc.
- environment: Where you define environment variables, like
JAVA_HOME. - stages: Where you define the actual workflow (Build, Test, Deploy, etc.).
Writing My First Jenkinsfile
Let's try to write a demo Jenkinsfile. This script will fetch code, run tests, and build the project.
pipeline {
    // where do we run the pipeline/which agent
    agent any
    tools {
        // which version of maven we use
        maven 'MAVEN3.9'
        // which version of jdk we use
        jdk 'JDK17'
    }

    stages {
        stage("Fetch code from git") {
            steps {
                // mention the pulgin we want to use and params
                git branch: 'atom', url : 'https://github.com/vvduth/vprofile-project.git'
            }
        }
        // run unit tsest using maven
        stage("Run Unit Tests") {
            steps {
                // run maven command to run unit tests
                sh 'mvn test'
            }
        }

        // install dependencies and build the project
        stage("Build Project") {
            steps {
                // run maven command to build the project
                sh 'mvn clean install -DskipTests=true'
            }
            post {
                // if build is successful
                success {
                    echo 'Build completed successfully!'
                    // use archiveArtifacts to store the built war file as a build artifact
                    archiveArtifacts artifacts: 'target/*.war'
                }
                // if build fails
                failure {
                    echo 'Build failed. Please check the logs for details.'
                }
            }
        }
    }
}
How to Run It
- Go to Jenkins Dashboard -> New Item.
- Select Pipeline.
- Scroll down to the Pipeline section.
- Paste the code above into the Script box.
- Click Save and then Build Now.
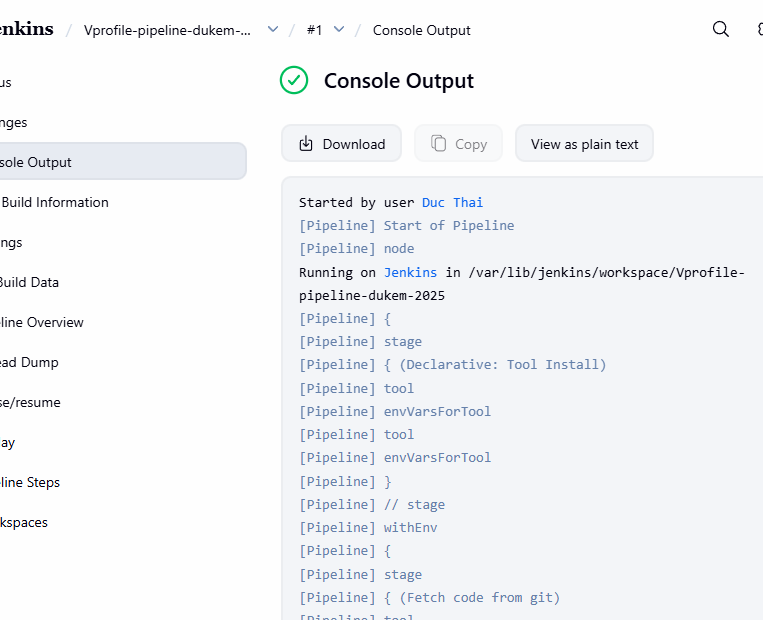
You should see the pipeline executing with stages for fetching code, running tests, and building the project. If everything goes well, you'll have your WAR file archived as a build artifact!
Code Analysis with SonarQube
What is code analysis?
It is the process of analyzing source code to find bugs, vulnerabilities, and "code smells" (code that works but is messy or hard to maintain).
We will use SonarQube and Checkstyle to check our code against predefined rules. This helps catch issues that hackers could exploit or logic errors that could break the app later.
Step 1: Configure Jenkins
First, ensure your SonarQube EC2 instance is powered on. Then, we need to do two things in Jenkins:
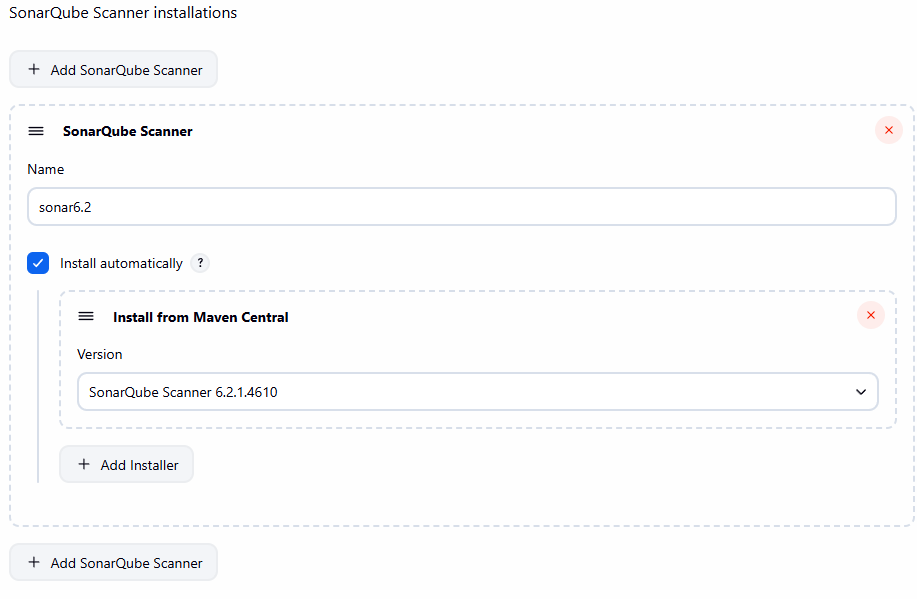
- Install the SonarQube Scanner tool.
- Add the SonarQube server details so Jenkins can talk to it.
Install Scanner:
Go to Manage Jenkins -> Global Tool Configuration -> Scroll to SonarQube Scanner -> Add SonarQube Scanner.
Configure Server:
- Go to Manage Jenkins -> Configure System -> Scroll to SonarQube servers.
- Add the server details.
- Name: Give it a recognizable name (e.g.,
sonarserver). - Server URL:
http://<sonarqube-ec2-private-ip>:80(Since our machines are in the same VPC, we use the private IP. Nginx is forwarding port 80 to 9000). - Token: You need to generate this on the SonarQube server.
- Name: Give it a recognizable name (e.g.,
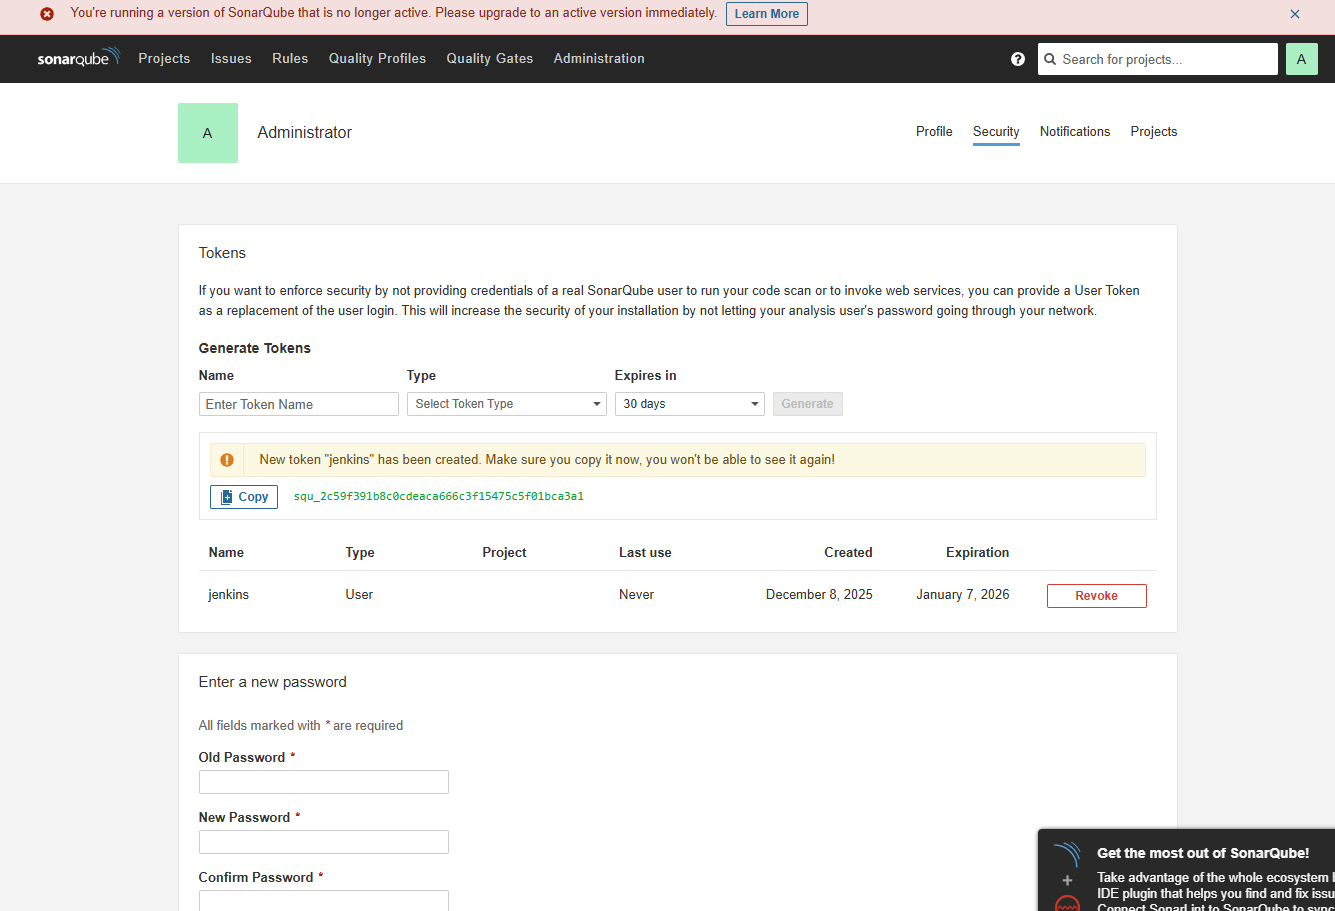
- Paste the generated token into Jenkins and save.
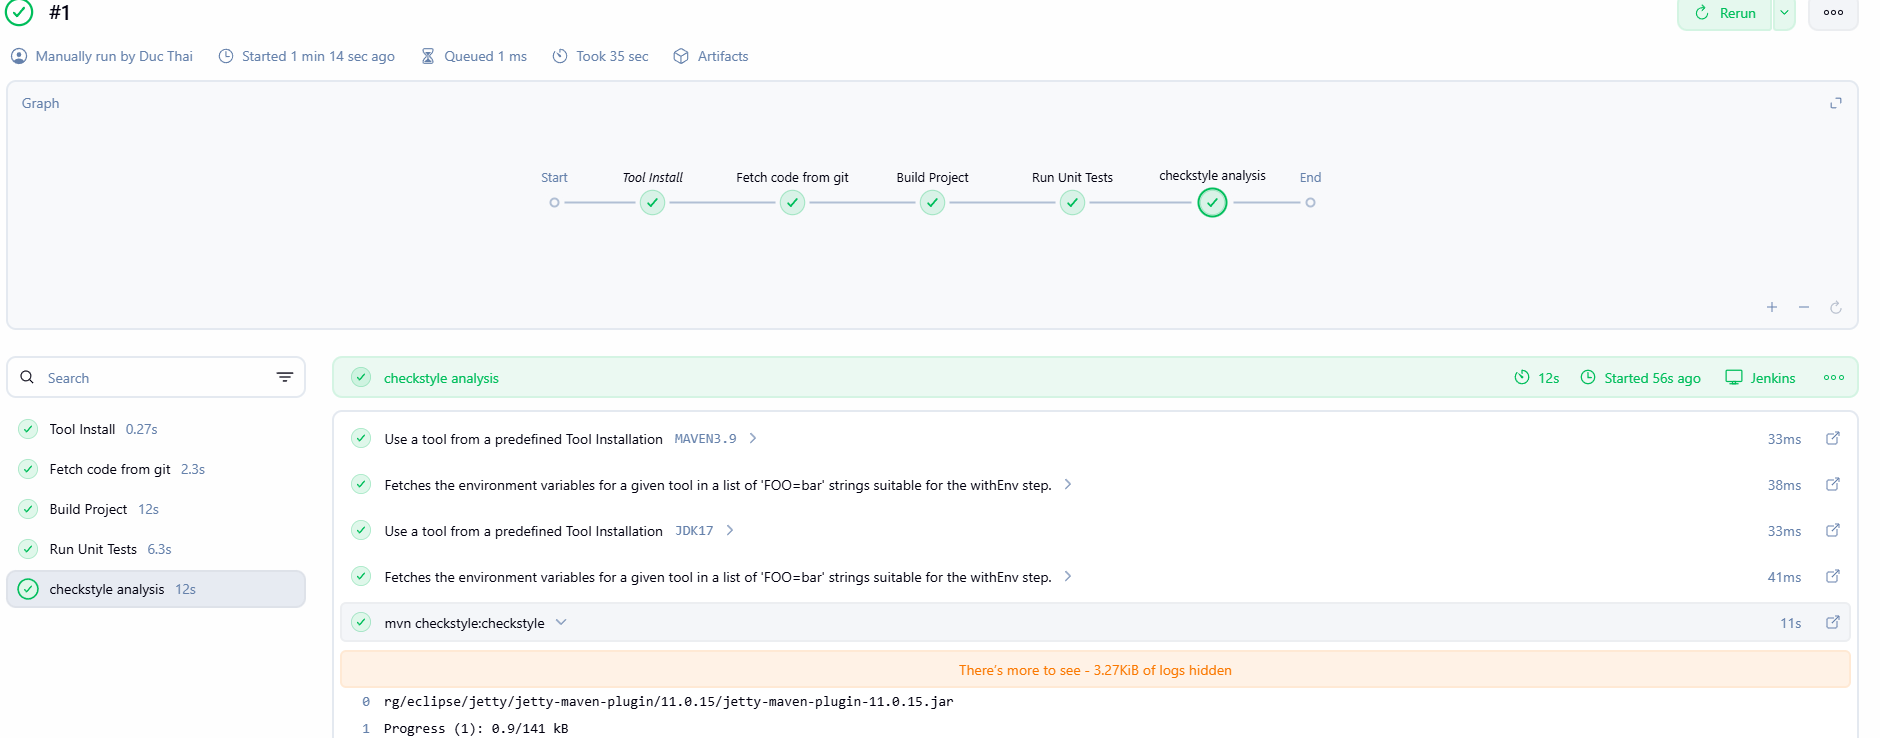
Step 2: Add Code Analysis to Jenkinsfile
Now, let's modify the Jenkinsfile to include a Checkstyle analysis stage after the unit tests.
  ....
    // run unit tsest using maven
        stage("Run Unit Tests") {
            steps {
                // run maven command to run unit tests
                sh 'mvn test'
            }
        }

        stage('checkstyle analysis') {
            steps {
                // run maven command to perform checkstyle analysis
                // nmaven will download checkstyle plugin and run it against the codebase
                sh 'mvn checkstyle:checkstyle'
            }
        }
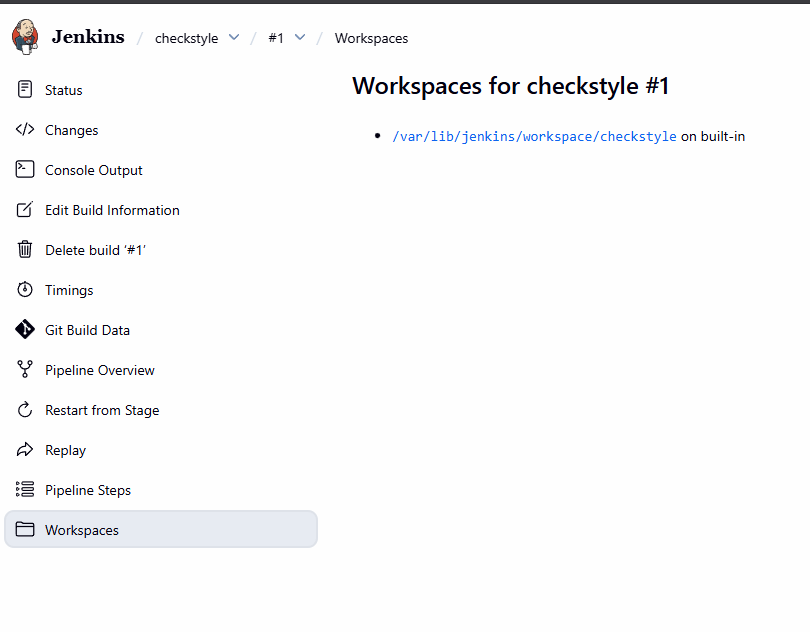
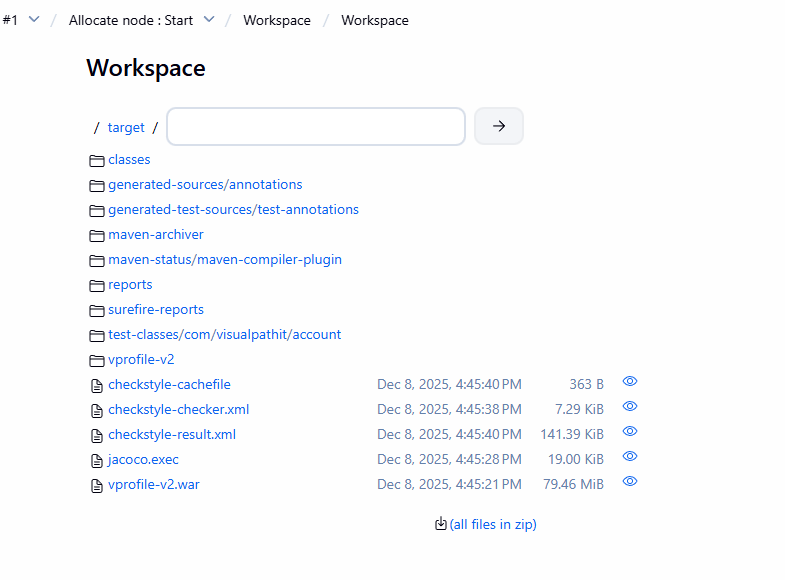
Inside the target/site directory, you will find the checkstyle-result.xml file. We can archive this as an artifact, but reading raw XML is painful. We will upload this to SonarQube for better visualization.
Step 3: Add SonarQube Analysis Stage
We will now add a stage to run the SonarQube scanner. This sends all our reports (JUnit, JaCoCo, Checkstyle) to the SonarQube server.
....
  stage("SonarQube Analysis") {
            environment {
                // find this in jenkins => tools
                scannerHome = tool 'sonar6.2'
            }
            steps {
                // the nae that you set in the sonarQube server configuration in jenkins
                withSonarQubeEnv('sonarserver') {
                    sh '''${scannerHome}/bin/sonar-scanner -Dsonar.projectKey=vprofile \
                    -Dsonar.projectName=vprofile \
                    -Dsonar.projectVersion=1.0 \
                    -Dsonar.sources=src/ \
                    -Dsonar.java.binaries=target/test-classes/com/visualpathit/accoun/controllerTest/ \
                    -Dsonar.junit.reportPaths=target/surefire-reports/ \
                    -Dsonar.jacoco.reportPaths=target/jacoco.exec \
                    -Dsonar.java.checkstyle.reportPaths=target/checkstyle-result.xml

                    '''
                }
            }
        }
Breakdown of the command:
projectKey: Unique ID for the project in SonarQube.sources: Location of your source code.java.binaries: Location of compiled Java classes.reportPaths: Locations of the various test reports we generated earlier.
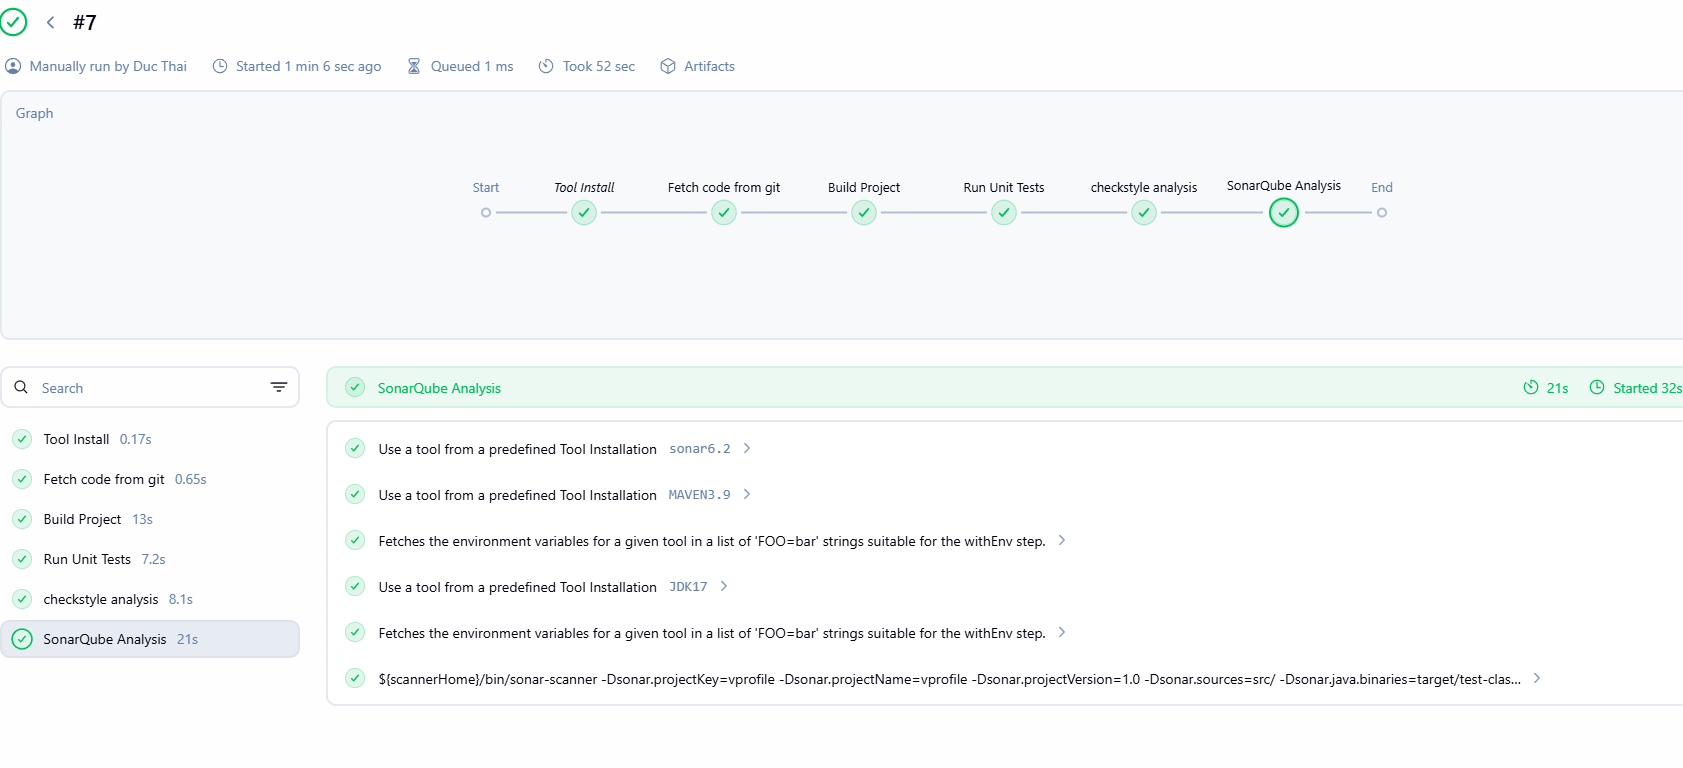
After a successful build, check your SonarQube dashboard. You should see your project listed there!
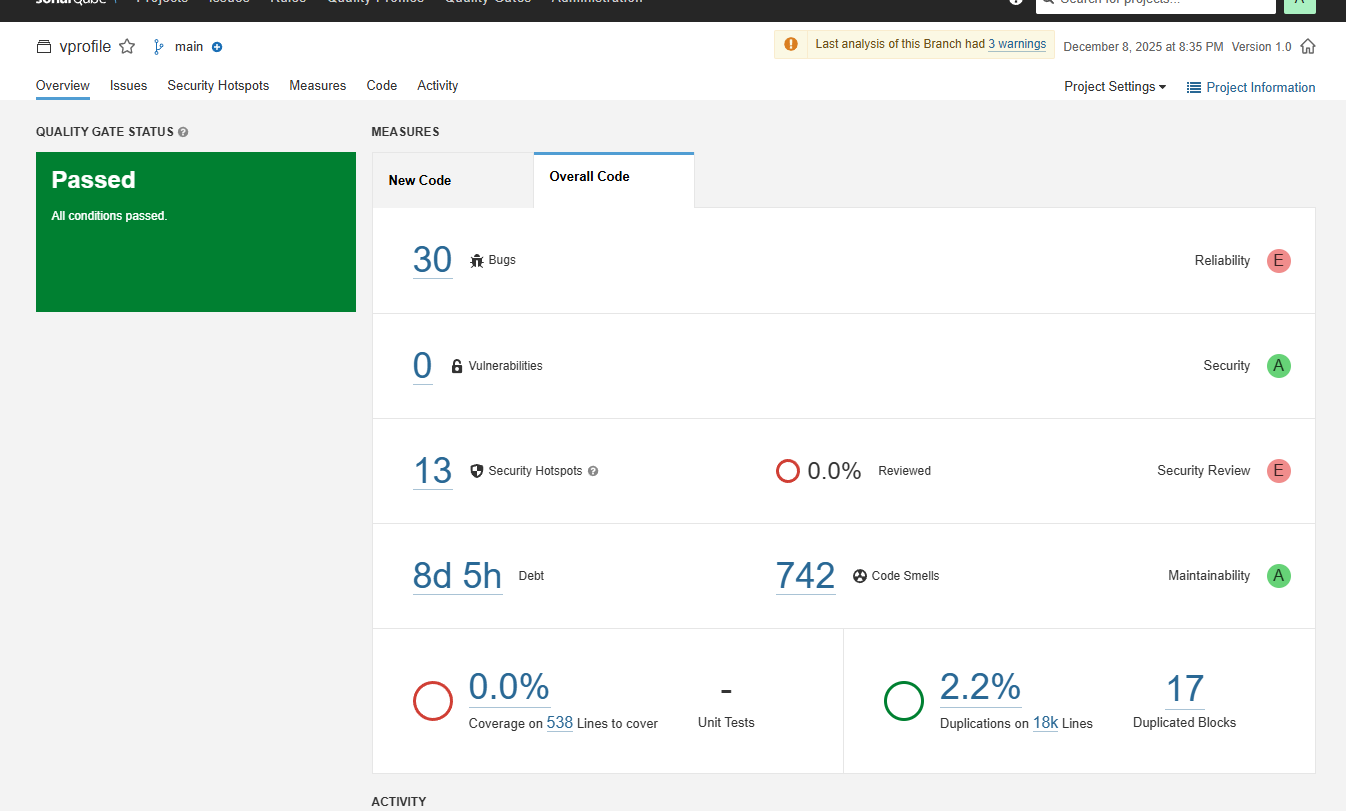
Setting Up Quality Gates
SonarQube comes with a default Quality Gate, but let's create our own to be strict about bugs.
- Go to SonarQube Server -> Quality Gates -> Create.
- Name it:
vprofile-quality-gate. - Add a condition: Bugs is greater than 10. This means if the code has more than 10 bugs, the pipeline should fail.
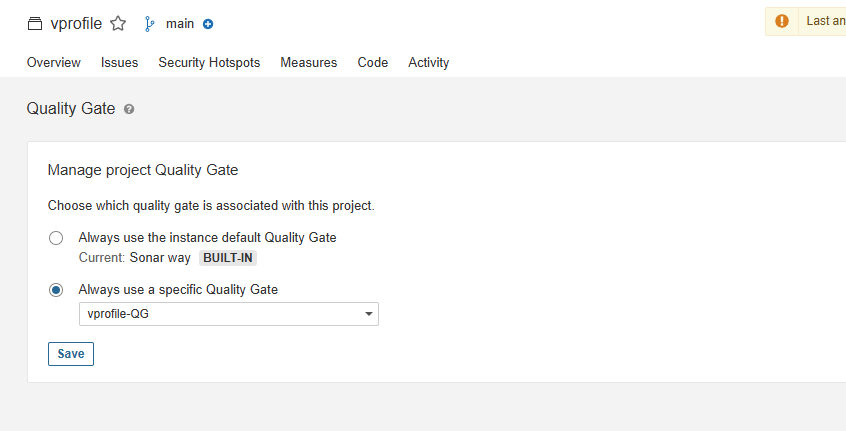
- Go to your Project Settings -> Quality Gate and select your new
vprofile-quality-gate.
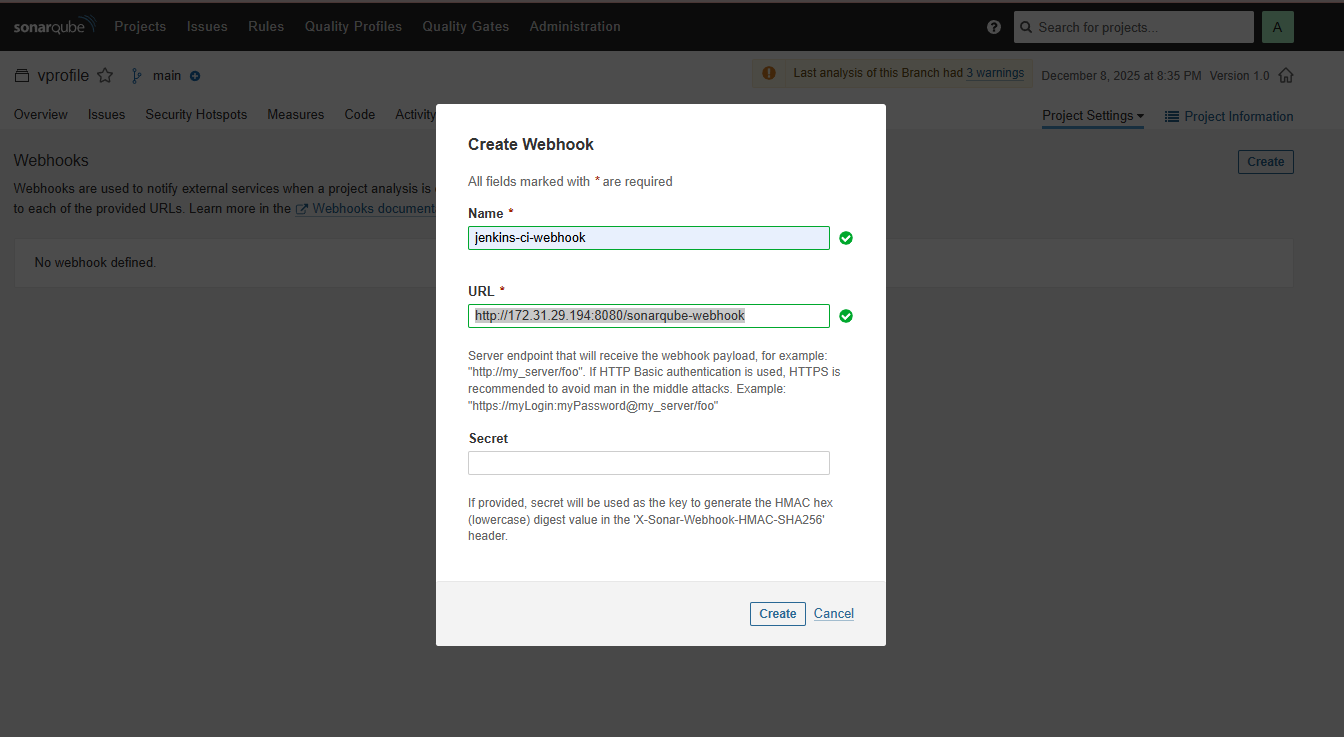
The Missing Link: Webhooks
Right now, Jenkins sends data to SonarQube, but it doesn't know if the Quality Gate passed or failed. It just says "Job Done!" and moves on. We need SonarQube to call Jenkins back and say, "Hey, this code is trash, fail the build."
- Go to SonarQube Server -> Project Settings -> Webhooks -> Create.
- Name:
jenkins-webhook - URL:
http://<jenkins-ec2-PRIVATE-ip>:8080/sonarqube-webhook/
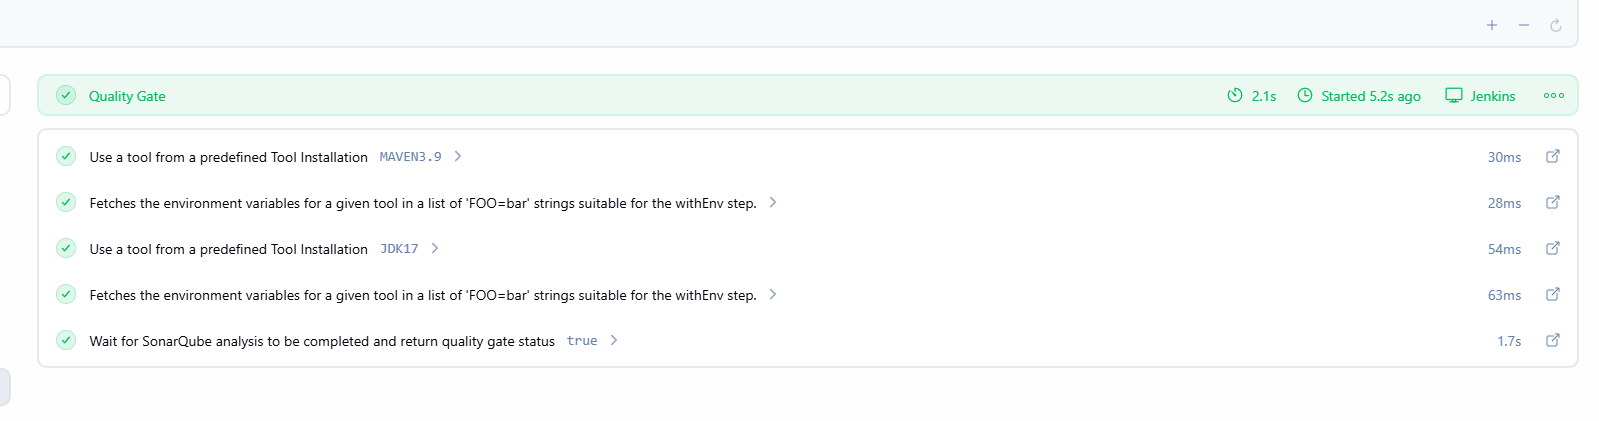
Step 4: Add Quality Gate Check to Jenkinsfile
Finally, add a stage to wait for SonarQube's response.
    stage("Quality Gate Check") {
                steps {
                    // wait for the quality gate result from sonarqube server
                    timeout(time: 1, unit: 'MINUTES') {
                        waitForQualityGate abortPipeline: true
                    }
                }
            }
Note: Ensure your Jenkins Security Group allows inbound traffic on port 8080 from the SonarQube server.
Testing the Pipeline
If your code has more than 10 bugs, the pipeline will now fail at the Quality Gate stage.
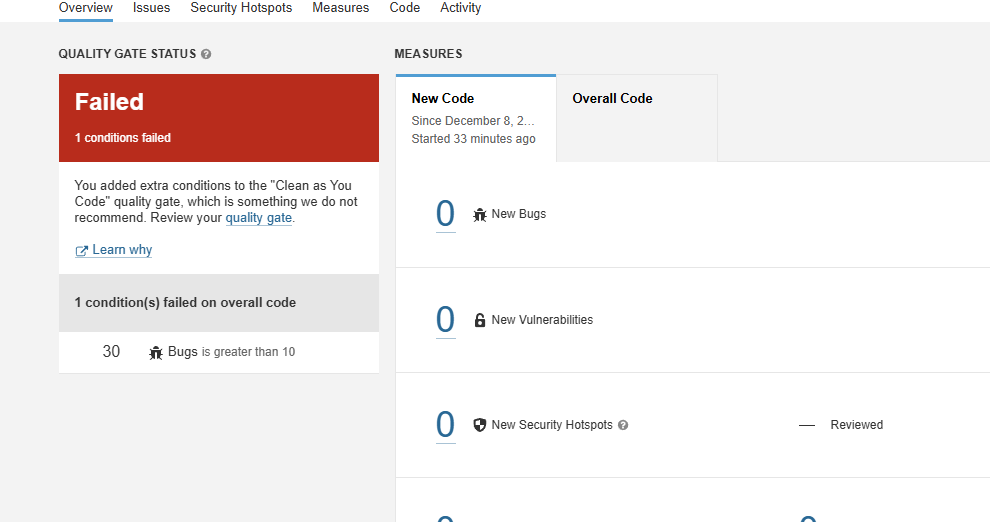
To fix this (for demonstration purposes), bump up the bug limit in your Quality Gate to 50, and run the pipeline again. It should pass!