![]()
VPC Monitoring with Flow Logs
Project Link: View Project
Author: Duc Thai
Email: ducthai060501@gmail.com
VPC Monitoring with Flow Logs
Introducing Today's Project!
What is Amazon VPC?
Amazon VPC (Virtual Private Cloud) is a virtual network in AWS that you control, similar to having your own private data center in the cloud. It lets you define IP ranges, subnets, route tables, and security settings.
It is useful because it allows you to isolate and secure resources, control how servers communicate with each other and the internet, and manage network traffic efficiently. Essentially, it gives you full control over your cloud network while keeping your applications safe and organized.
How I used Amazon VPC in this project
In today's project, I used Amazon VPC to create two separate networks and launch EC2 instances in each. I configured subnets, route tables, security groups, and flow logs to control and monitor network traffic. This setup allowed me to test VPC peering, track communication between instances, and analyze traffic patterns, helping me understand how VPCs manage network connectivity and security in AWS.
One thing I didn't expect in this project was...
One thing I didn’t expect in this project was how detailed network monitoring can be. Setting up VPC Flow Logs and analyzing traffic showed me that even small amounts of data—like individual packets or rejected connections—can provide valuable insights, and that careful configuration of security groups, route tables, and IAM roles is crucial for accurate monitoring.
This project took me...
This project took me 90 minutes,
In the first part of my project...
Step 1 - Set up VPCs
In this step, I will set up 2 VPCs from scratch using the VPC wizard in the AWS console because I want to create two isolated networks that can be managed and connected later for monitoring and testing purposes. This helps me understand how networking works in AWS from the ground up, including IP address ranges, subnets, and routing configurations.
Step 2 - Launch EC2 instances
In this step, I will launch an EC2 instance in each VPC because they act as virtual machines that allow me to test connectivity between the two VPCs. By sending and receiving traffic between these instances, I can verify if the VPC peering connection works correctly and if both networks can communicate as expected.
Step 3 - Set up Logs
In this step, I will set up a way to track all inbound and outbound network traffic using VPC Flow Logs because they help me monitor, analyze, and troubleshoot network connections. Flow logs record details about the traffic going in and out of my VPC, subnets, and network interfaces. By storing these logs in CloudWatch, I can later review which connections are allowed or denied, find issues with communication between instances, and improve my network’s security and performance.
Step 4 - Set IAM permissions for Logs
In this step, I will give VPC Flow Logs permission to write and send logs to CloudWatch by creating an IAM role and attaching a policy. This is necessary because when I first set up the flow logs, there wasn’t an IAM role designed for them. The IAM role gives Flow Logs the right access to deliver network traffic data to CloudWatch Logs, where I can view and analyze all inbound and outbound traffic from my subnet.
Multi-VPC Architecture
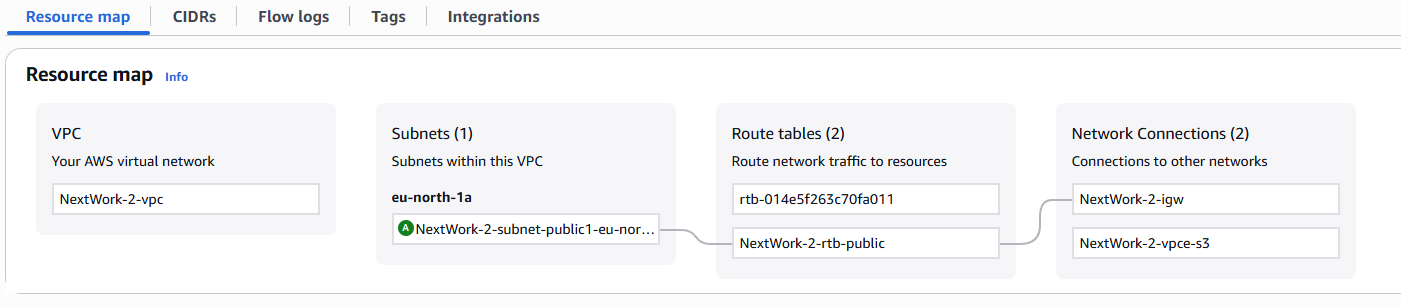
I started my project by launching 2 VPCs, each with a unique IPv4 CIDR block. Each VPC has one public subnet, which allows resources within the subnet to communicate with the internet through an internet gateway. This setup gives me a simple network structure to test connectivity and monitoring later in the project.
The IPv4 CIDR blocks for VPCs 1 and 2 are unique because each VPC needs its own non-overlapping IP address range. If the CIDR blocks were the same or overlapping, the VPCs wouldn’t know where to send the traffic, and routing between them would fail. Using unique CIDR blocks (10.1.0.0/16 and 10.2.0.0/16) ensures that each VPC can clearly identify its own network and communicate properly during monitoring or peering.
I also launched EC2 instances in each subnet
My EC2 instances' security groups allow ICMP traffic from all IP addresses because ICMP is needed for the ping command, which tests network connectivity between the two instances. Allowing ICMP from all IPs ensures that the instances can send and receive ping requests freely, helping me confirm that the VPC peering connection is working correctly.
Logs
Logs are like a diary for your computer systems. They record everything that happens, from users logging in to errors popping up. It's the go-to place to understand what's going on with your systems, troubleshoot problems, and keep an eye on who’s doing what.
Log groups in AWS are like folders in Amazon CloudWatch that organize and store related log streams together. Each log group usually represents logs from a single application, service, or resource. For example, all logs from one EC2 instance or VPC Flow Log can be stored in the same log group. Log groups are region-specific, meaning they only store data generated in that AWS region. However, you can still use CloudWatch dashboards to view and analyze logs from multiple regions in one place.
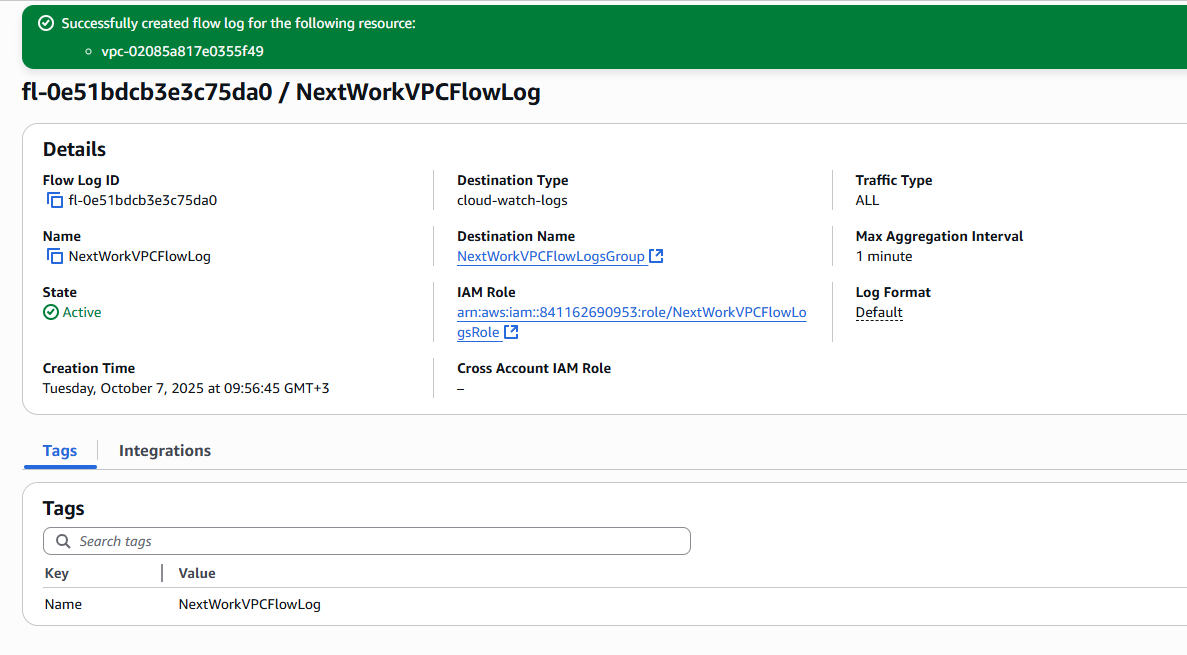
I also set up a flow log for VPC 1
IAM Policy and Roles
I created an IAM policy because it defines the specific permissions that allow VPC Flow Logs to write log data to CloudWatch. Without this policy, the flow logs wouldn’t have the right to send or store traffic information. The policy acts as a set of rules that tells AWS what actions Flow Logs can perform and which resources they can access.
I also created an IAM role because the role uses the IAM policy to grant VPC Flow Logs permission to write data to CloudWatch. The role acts as a secure identity that Flow Logs assumes when sending traffic information, ensuring that the logs have the correct access without exposing unnecessary permissions.
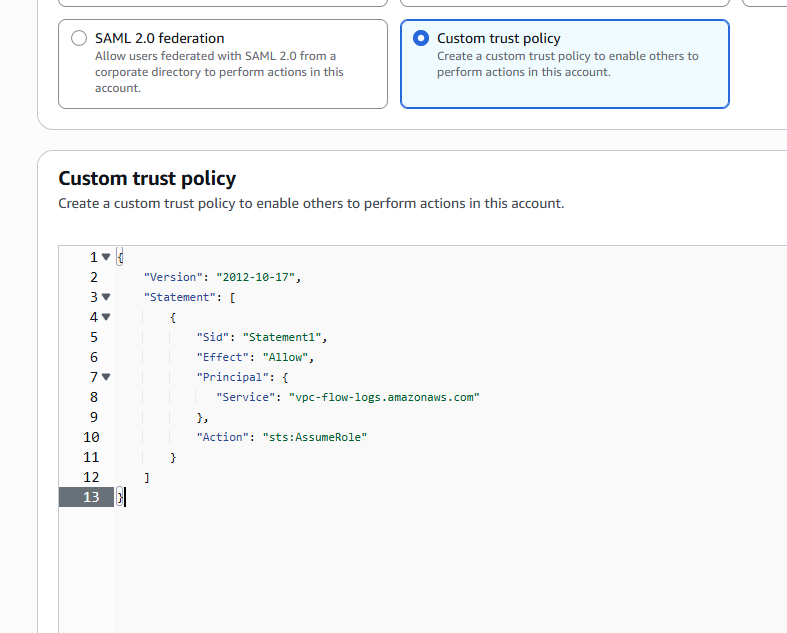
A custom trust policy is a JSON document in AWS that defines which entities (users, services, or accounts) are allowed to assume an IAM role. It specifies who can “trust” the role and use its permissions. For example, when setting up VPC Flow Logs, a custom trust policy allows the Flow Logs service to assume the role you created so it can write logs to CloudWatch. It’s essentially a way to control who or what can act using the role.
In the second part of my project...
Step 5 - Ping testing and troubleshooting
In this step, I will get Instance 1 to send test messages to Instance 2 because the flow log setup is complete. By generating some network traffic between the instances, I can check whether the VPC Flow Logs are correctly capturing and recording the traffic, which helps me verify that monitoring is working as expected.
Step 6 - Set up a peering connection
In this step, I will create a VPC peering connection and configure the route tables because I want to enable direct communication between VPC 1 and VPC 2. The peering connection links the two VPCs, and updating the route tables tells each VPC how to send traffic to the other, allowing instances to communicate using their private IP addresses.
Step 7 - Analyze flow logs
In this step, I will review the flow logs recorded for VPC 1's public subnet and analyze them to get some tasty insights because flow logs show all inbound and outbound network traffic. By examining the logs, I can see which connections succeeded or failed, identify potential security issues, and understand how traffic flows in and out of the subnet, helping me monitor and troubleshoot the network effectively.
Connectivity troubleshooting
My first ping test between my EC2 instances had no replies, which means a key part of the network was missing: the VPC peering connection. Without this direct link, the two VPCs cannot communicate using their private IP addresses. Setting up the peering connection allows traffic to flow securely between the instances across the VPCs.
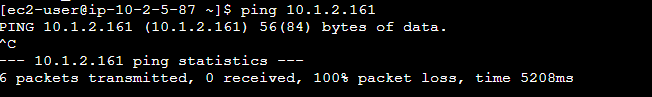
I could receive ping replies if I ran the ping test using the other instance's public IP address, which means the instances can communicate over the internet, but not yet through their private IPs. This shows that the VPCs aren’t connected directly, and a VPC peering connection is needed for private, internal communication between the two networks.
Connectivity troubleshooting
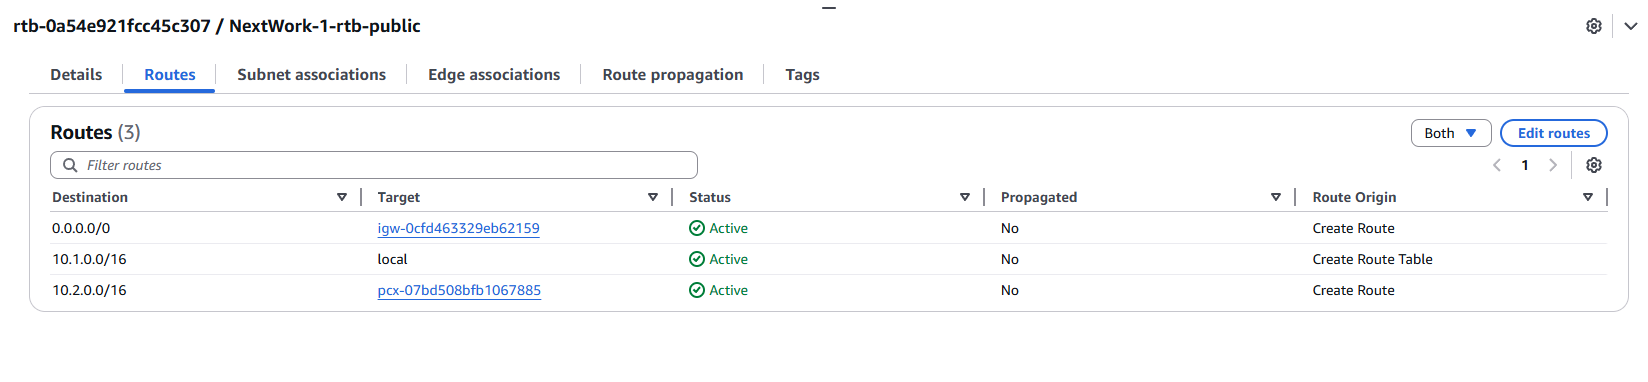
Looking at VPC 1's route table, I identified that the ping test to Instance 2's private address failed because there was no route directing traffic from VPC 1 to VPC 2. Without a route through the VPC peering connection, VPC 1 doesn’t know how to send packets to VPC 2’s private IP range, so the communication fails.
To solve this, I set up a peering connection between my VPCs
I also updated both VPCs' route tables so that traffic destined for the other VPC would be sent through the peering connection. This ensures that instances in VPC 1 and VPC 2 can communicate using their private IP addresses, making the peering connection functional and enabling secure internal network traffic.
Connectivity troubleshooting
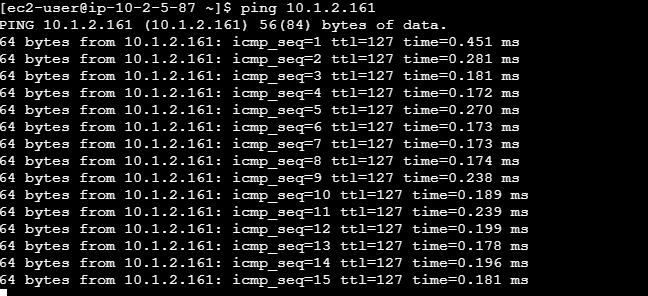
I received ping replies from Instance 2's private IP address! This means the VPC peering connection and route tables are correctly configured, allowing the two VPCs to communicate directly and securely using private IP addresses. The network traffic is flowing as intended between the instances.
Analyzing flow logs
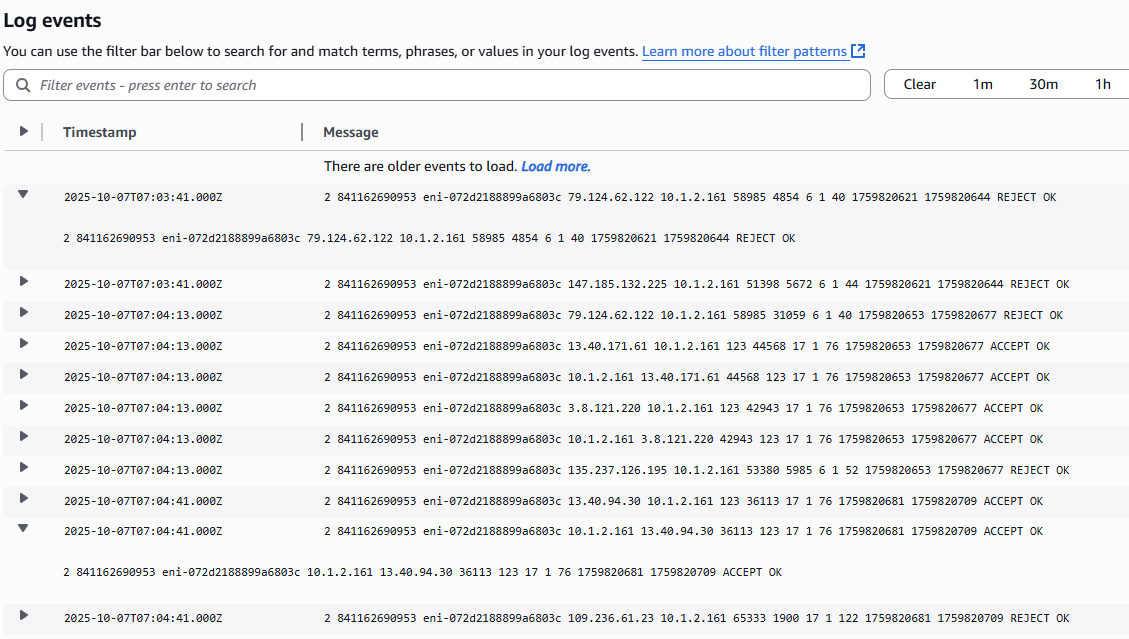
Flow logs tell us about network traffic in a VPC, subnet, or network interface. Each entry includes several parts:
Account ID (e.g., 841162690953) – the AWS account that owns the resource.
Network interface ID (e.g., eni-072d2188899a6803c) – the specific interface where traffic occurred.
Source and destination IP addresses (e.g., 79.124.62.122 → 10.1.2.161).
Source and destination ports (e.g., 58985 → 4854).
Protocol number (e.g., 6 for TCP).
Packets and bytes count (e.g., 1 packet, 40 bytes).
Start and end time (e.g., 1759820621 → 1759820644).
Action (e.g., REJECT or ACCEPT) – whether the traffic was allowed or denied.
Log status (e.g., OK) – confirms the log was successfully recorded.
Flow logs provide a detailed view of who is talking to whom, how much data is transferred, and whether it was allowed or blocked, helping monitor and troubleshoot network activity.
For example, the flow log I’ve captured tells us that a connection from source IP 79.124.62.122 to destination IP 10.1.2.161 on port 4854 was blocked (REJECT). It also shows which network interface handled the traffic, the number of packets and bytes sent, the protocol used (TCP), and the time of the traffic. This information helps me understand traffic patterns, identify blocked connections, and troubleshoot network issues in the VPC.
Logs Insights
Logs Insights is an AWS tool that lets you search, analyze, and visualize log data stored in CloudWatch. It helps you quickly find patterns, filter specific events, and generate reports or charts from large amounts of log data, making it easier to monitor, troubleshoot, and understand network or application activity.
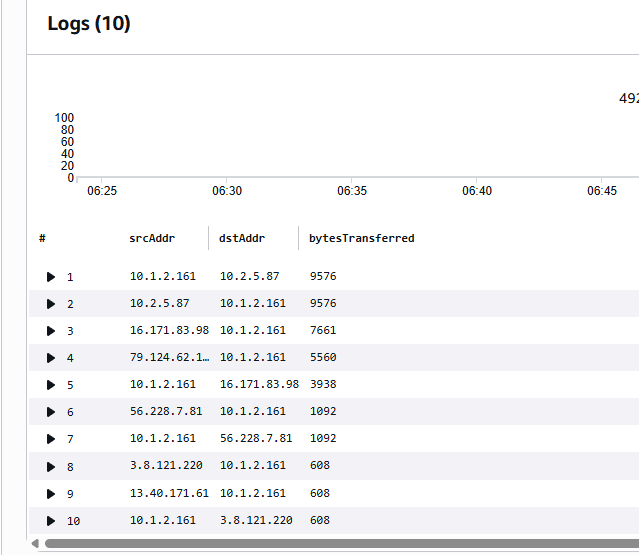
I ran the query “Top 10 byte transfers by source and destination IP addresses”, which in CloudWatch Logs Insights looks like:
stats sum(bytes) as bytesTransferred by srcAddr, dstAddr
| sort bytesTransferred desc
| limit 10
This query analyzes all traffic in the flow logs, sums up the total bytes transferred between each source and destination IP pair, sorts them from highest to lowest, and shows the top 10 connections. It helps identify which hosts are exchanging the most data, revealing traffic patterns and potential hotspots in the network.